字数:6168
引言
本文简单介绍以下内容:
- (1)如何用jmeter做接口的压力测试
- (2)如何用btrace来跟踪接口的时间的具体消耗
jmeter压接口
我这里用的是jmeter version 3.1 r1770033,提交号好大!
(1)添加一个线程组Thread Group
右击plan -> add -> threads (users) -> Thread Group,给线程组起个名字,关键项:Number of Threads (users)/Ramp-Up Period (in seconds)/Loop Count (不设值则勾选上Forever)
(2)添加HTTP Request
右击刚添加的Thread Group -> add -> sampler -> HTTP Request,给请求起个名字,关键项:Server Name or IP/Port Number/Method/Content encoding/Path/Parameters
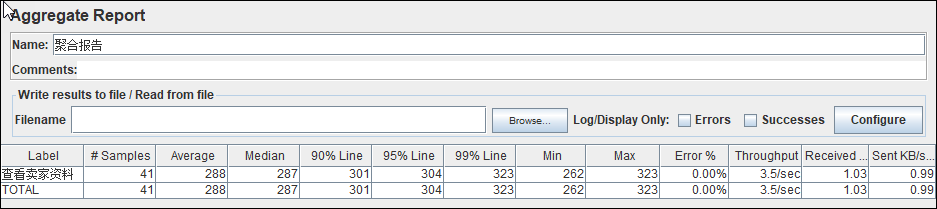
(3)添加聚合报告Aggregate Report
右击刚添加的HTTP Request -> add -> Listener -> Aggreegate Report,起个名字,没什么可设置的,主要是为了统计发送的次数,失败的次数以及比率,耗时分布与平均耗时等,比如:
(4)添加查看树View Results Tree
右击刚添加的HTTP Request -> add -> Listener -> Aggreegate Report,起个名字,没什么可设置的,主要是为了查看单个请求的处理结果,以及基本信息
btrace看时间消耗节点
用jmeter可以初步看出一个api的时间消耗,但是api里业务实现可能查多个表,每一步消耗的时间怎样?到底卡在哪里,如何发现,btrace可以窥探一二。btrace不需要改原工程的代码,可不像切面编程,近似无侵入,虽表面上能做的非常有限,但是能方便定位问题不就够了吗?
(1)下载安装
这次用的btrace的版本是1.3.11,从这里下载,解压,运行bin里的程序即可
(2)创建脚本
下面创建一个简单的脚本来分析上文的接口查看卖家资料里的具体时间消耗:ubuntu@VM-0-13-ubuntu:~/program/btrace-1.3.11$ vim checking/DurationMethod.java
import com.sun.btrace.annotations.*;
import static com.sun.btrace.BTraceUtils.*;

@BTrace
public class DurationMethod {
    @OnMethod(clazz = "de.tao.serv.rest.core.SaleServ",method = "getSalerInfo",location=@Location(Kind.RETURN))
    public static void printMethodRunTime1(@ProbeClassName String probeClassName,@Duration long duration){
        println("1GET SALES INFO: " + probeClassName + ", duration:" + duration / 1000000 + " ms");
    }

    @OnMethod(clazz = "de.tao.serv.service.UserService",method = "getCompanyManager",location=@Location(Kind.RETURN))
    public static void printMethodRunTime2(@ProbeClassName String probeClassName,@Duration long duration){
        println("3GET USER  INFO: " + probeClassName + ", duration:" + duration / 1000000 + " ms");
    }

    @OnMethod(clazz = "de.tao.serv.service.CompanyService",method = "getCompanyById",location=@Location(Kind.RETURN))
    public static void printMethodRunTime3(@ProbeClassName String probeClassName,@Duration long duration){
        println("2GET COMPANY INFO: " + probeClassName + ", duration:" + duration / 1000000 + " ms");
    }
}
(3)预编译脚本
bin/btracec checking/DurationMethod.java
(4)执行脚本
bin/btrace 23588 checking/DurationMethod.java,其中23588是java web程序的主进程,可以通过sudo ps -e|grep java或top -c查得
执行打印为:
1GET SALES INFO: de.tao.serv.rest.core.SaleServ, duration:255 ms
2GET COMPANY INFO: de.tao.serv.service.CompanyService, duration:1 ms
3GET USER  INFO: de.tao.serv.service.UserService, duration:276 ms
可见整个接口1,时间主要消耗在GET USER INFO上,这样就可以针对性地改进
结论更新
貌似这个时间统计不是十分精确,比如测试这个接口的耗时详情:
@GET
@Path("/saler/company/{id_company}/info")
public FrmSalerInfo getSalerInfo(@PathParam("id_company") long id_company){
    long t1 = System.currentTimeMillis();
    //查公司信息
    Company c = companyService.getCompanyById(id_company);
    long t2 = System.currentTimeMillis();

    //查管理员信息
    CompanyUser cu = userService.getManagerUserOfCompany(c.getId());
    long t3 = System.currentTimeMillis();

    User u = userService.getUser(cu.getUid());
    long t4 = System.currentTimeMillis();

    if (c == null || u == null) {
        return null;
    }
    FrmSalerInfo info = new FrmSalerInfo();
    info.setCompany_address(c.getCompany_address());
    info.setCompany_name(c.getCompany_name());
    info.setContact(u.getUname());
    info.setEmail(u.getUemail());
    info.setPhone(u.getUphone());
    long t5 = System.currentTimeMillis();


    log.info("t2-t1={}, t3-t2={}, t4-t3={}, t5-t4={}", new Object[] {
            t2-t1, t3-t2, t4-t3, t5-t4
    });

    return info;
}
然后写的测试脚本是:
import com.sun.btrace.annotations.*;
import com.sun.btrace.annotations.*;
import static com.sun.btrace.BTraceUtils.*;

@BTrace
public class DurationMethod {
    @OnMethod(clazz = "de.tao.serv.rest.core.SaleServ",method = "getSalerInfo",location=@Location(Kind.RETURN))
    public static void printMethodRunTime1(@ProbeClassName String probeClassName,@Duration long duration){
        println("1GET SALES INFO: " + probeClassName + ".getSalerInfo, duration:" + duration / 1000000 + " ms");
    }
    @OnMethod(clazz = "de.tao.serv.service.CompanyService",method = "getCompanyById",location=@Location(Kind.RETURN))
    public static void printMethodRunTime3(@ProbeClassName String probeClassName,@Duration long duration){
        println("2GET COMPANY INFO: " + probeClassName + ".getCompanyById, duration:" + duration / 1000000 + " ms");
    }
    @OnMethod(clazz = "de.tao.serv.service.UserService",method = "getManagerUserOfCompany",location=@Location(Kind.RETURN))
    public static void printMethodRunTime31(@ProbeClassName String probeClassName,@Duration long duration){
        println("3GET COMPANY USER: " + probeClassName + ".getManagerUserOfCompany, duration:" + duration / 1000000 + " ms");
    }
    @OnMethod(clazz = "de.tao.serv.dao.UserDao",method = "getUser",location=@Location(Kind.RETURN))
    public static void printMethodRunTime32(@ProbeClassName String probeClassName,@Duration long duration){
        println("4GET USER: " + probeClassName + ".getUser, duration:" + duration / 1000000 + " ms");
    }
}
log打出来的4个时间差是: t2-t1=41, t3-t2=36, t4-t3=523, t5-t4=0,即主要的时间消耗在4GET USER这个点上,但是btrace统计出来重点在1GET SALES INFO,详情的情况是:
1GET SALES INFO: de.tao.serv.rest.core.SaleServ.getSalerInfo, duration:1366 ms
2GET COMPANY INFO: de.tao.serv.service.CompanyService.getCompanyById, duration:40 ms
3GET COMPANY USER: de.tao.serv.service.UserService.getManagerUserOfCompany, duration:36 ms
4GET USER: de.tao.serv.dao.UserDao.getUser, duration:153 ms